Storage bandwidth performance benchmarks
Testing Methodology
The disk I/O bandwidth could be measured in a VM running Linux or Windows. The sequential read or write bandwidth measured in the VM indicates the maximum speed the VM is able to retrieve or record data that forms one contiguous, ordered block of data. The sequential read or write bandwidth is measured in MB/s (MegaBytes per Second). In addition, the measured bandwidth could be compared with the performance numbers published by the vendor of physical NVMe drive to see how much raw performance the VM could consume.
Testing Tools
FIO
Supported OS: Linux and Windows
FIO is an industry standard benchmark for measuring disk I/O performance. Fio spawns a number of threads or processes doing a particular type of I/O action as specified by the user. We include it here as a baseline measurement on all infrastructure to compare raw disk performance that any application can potentially achieve.
VDBench
Supported OS: Linux and Windows
VDBench is a command line utility specifically created to help engineers and customers generate disk I/O workloads to be used for validating storage performance and storage data integrity.
DiskSpd
Supported OS: Windows
Microsoft recommends to use the DiskSpd utility for generating a load on a disk (storage) system and measuring its performance. This is a command line interface tool that can perform I/O operations with the specified drive target in several threads. DiskSpd could measure the maximum available read/write bandwidth, IOPS and latency.
DD
Supported OS: Linux
DD is a common utility in linux distributions for measuring disk bandwidth. We include it here as a baseline measurement on all infrastructure to compare raw disk bandwidth performance that any application can potentially achieve. Note that disk bandwidth is not always a good measurement for high volume small block transactions such as a database application might generate. For this you should check the FIO measurements.
Test Setup
FIO - Ubuntu 18.04
- Create a Ubuntu VM with three disks attached, where one disk is the boot drive and the other two disks would be used for storage performance test. A tutorial for the VM setup on the Sunlight platform is available here.
- Prepare the VM to have proper irqbalance setting. (A script is available here).
- Download the FIO tool (a binary executive file is available for download here).
- Provide a FIO configuration file to specify the relevant parameters, including the disk to test, I/O action (rw=read for read or rw=write for write), block size and iodepth. The block size is suggested to be a relatively large size in order to match a real world scenario, such as 64k or larger. An example for Ubuntu to test the 2nd and 3rd drives simultaneously is provided below and also available for download here
[global]
norandommap
gtod_reduce=1
group_reporting=1
ioengine=libaio
time_based=1
rw=read
bs=128k
direct=1
ramp_time=5
runtime=30
iodepth_batch=32
iodepth_batch_complete=8
iodepth_low=16
iodepth=32
loops=3

[job1]
filename=/dev/xvdb

[job2]
filename=/dev/xvdc
- Run the FIO test with a configuration file and the numjobs parameter specifying the number the cores used for the test.
sudo ./fio-3.2 read.fio --numjobs=16
The same fio configuration file is used when comparing a VM running on different environment. Make sure to change the configuration file to access the correct block device name that you wish to test, e.g. /dev/sda or /dev/xvda.
FIO - Windows Server 2016
- Create a Windows VM with three disks attached, where one disk is the boot drive and the other two disks would be used for storage performance test. A tutorial for the VM setup on the Sunlight platform is available here.
- Download the FIO tool (an Windows installer is available for download from Sunlight or a third party).
- Run the installer to install the FIO program to the Windows VM.
- Provide a FIO configuration file to specify the relevant parameters, including the disk to test, I/O action (rw=read for read or rw=write for write), block size and iodepth. The block size is suggested to be a relatively large size in order to match a real world scenario, such as 64k or larger. An example for Windows to test the 2nd and 3rd drives simultaneously is provided below and also available for download here.
[global]
norandommap
gtod_reduce=1
group_reporting=1
ioengine=windowsaio
time_based=1
rw=read
bs=128k
direct=1
ramp_time=5
runtime=30
iodepth_batch=32
iodepth_batch_complete=8
iodepth_low=16
iodepth=32
loops=3
thread=1

[job1]
filename=\\.\PhysicalDrive1

[job2]
filename=\\.\PhysicalDrive2
- Run the FIO test with a configuration file and the numjobs parameter specifying the number the cores used for the test.
fio win_read.fio --numjobs=4
DiskSpd - Windows Server 2016
- Create a Windows VM with three disks attached, where one disk is the boot drive and the other two disks would be used for storage performance test. A tutorial for the VM setup on the Sunlight platform is available here.
- Download the DiskSpd tool (available for download from Sunlight or the official repository).
- Extract the package to a directory on the Windows VM.
- Open the Command Prompt as Administrator and go to the corresponding directory under the DiskSpd tool package, e.g. amd64.
- Provide a collection of parameters to specify the operations of the test.
- c50G – file size 50 GB (it is better to use a large file size so that it does not fit in the cache of the storage controller)
- d300 – test duration in seconds
- r – random read/write operations (if you need to test sequential access, use –s)
- t8 – number of threads
- w40 – ratio of write to read operations 40%/60%
- o32 — queue length
- b64K — block size
- Sh — do not use cache
- L — measure latency
- E:\diskpsdtmp.dat – test file path
- Use the Disk Management tool on Windows to create two new volumes on the 2nd and 3rd disk respectively.
- An example to test the random read IOPS on Windows against the 2nd and 3rd drives simultaneously is as follows.
diskspd.exe -c50G -d30 -r -w0 -t4 -o32 -b4K -Sh -L D:\SpeedTest\testfile.dat E:\SpeedTest\testfile.dat
DD - Ubuntu
The same dd command is used in all cases to provide a fair comparison.
dd if=/dev/xvda of=/dev/null bs=32M count=500 iflag=direct
dd if=/dev/zero of=./out.img bs=32M count=500 oflag=direct
Results
FIO - throughput from different operating systems on Sunlight
| Platform | OS | Number of cores | Memory size (GB) | Disk size (GB) | Physical NVMe drive | Read Bandwidth (MB/s) | Write Bandwidth (MB/s) |
|---|---|---|---|---|---|---|---|
| Sunlight on premise (Intel BP) | Ubuntu 18.04 | 16 | 64 | 2 x 80 | Intel P4610 1.6TB | 6756 | 4136 |
| Sunlight on premise (Intel BP) | Windows Server 2016 | 16 | 64 | 2 x 80 | Intel P4610 1.6TB | 5270 | 3950 |
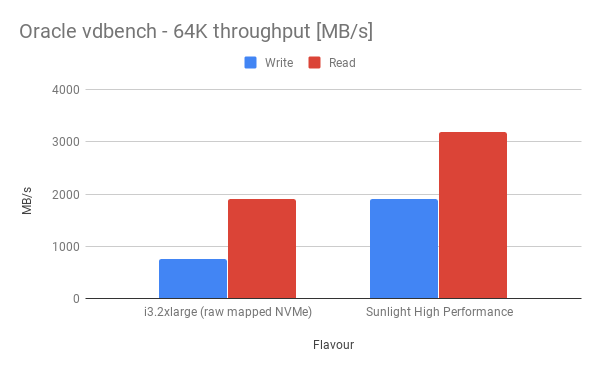
VDBench - bandwidth (64K ) from Ubuntu on different platforms
| Flavour | Read Bandwidth (MB/s) | Write Bandwidth (MB/s) | Combined RW (50:50) Bandwidth (MB/s) |
|---|---|---|---|
| i3.2xlarge (raw mapped NVMe) | 1907 | 763 | 1335 |
| Sunlight | 3200 | 1899 | 2549.5 |
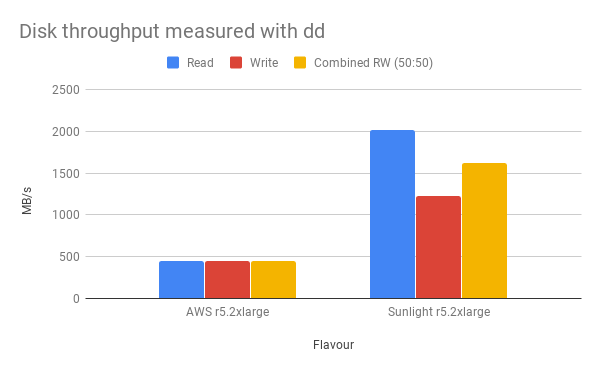
DD - bandwidth (64K) from Ubuntu on different platforms
| Flavour | Read Bandwidth (MB/s) | Write Bandwidth (MB/s) |
|---|---|---|
| AWS r5.2xlarge + 50K reserved iops | 449 | 449 |
| SUnlight AWS r5.2xlarge | 2024 | 1228.8 |