Oracle Database 12c
The Oracle Database application suite is still one of the most widely deployed commercial database apps today. It is used to support a very wide variety of usecases such as ERP systems, CRM systems, E-Commerce solutions etc.. Given the nature of the commercial licensing, performance and tuning are critical to ensure that a consumer gets the optimal performance per $ out of their investment.
On this page we provide the methodologies and tools used by us to setup and evaluate the performance of Oracle database running on different platforms and configurations. The more details are provided in the following sections.
Testing Tool
When the Oracle database is the choice for your application, it is needed to assess Oracle random physical I/O capability on a given environment/platform in preparation for OLTP/ERP style workloads. There is no shortage of transactional benchmarks such as Dominic Giles’ Swingbench and cost-options such as Benchmark Factory. However, the problem with these kits is these kits are transactional so they are more suitable to prove Oracle scales those applications, rather than test database I/O characteristics. These transactional test kits involve physical I/O but the ratio of CPU utilisation to handle physical I/O is generally low and most CPU resources are being used to execute Oracle intrinsic transaction code paths.
Oracle SLOB – the Silly Little Oracle Benchmark is a complete toolkit for generating I/O through an Oracle database. SLOB is the tool to analyse the I/O capabilities of your Oracle database. SLOB testing has been used by many industrial vendors to show the SLOB results in their use cases, which are available here as a collection of articles.
The focus of the tests covered in this page is the database I/O characteristics, so SLOB is utilised to analyse the performance of database I/O. Considering SLOB is just an Oracle I/O workload generation tool, rather than a database benchmark tool, there isn't a direct performance indicator provided by SLOB. The actual I/O performance will be assessed by the standardised set of performance metrics and resource metrics collected by Oracle database. The metrics and their indications will be introduced more in details when they are used for evaluating the performance in the sections below.
SLOB Setup and Configuration
The SLOB kit is available to be downloaded here at SLOB repository. A full documentation for usage of SLOB is available at this PDF file.
The SLOB's configurations involved in the performance tests are follows. For more guidance about the tunable parameters of SLOB please find them in the SLOB documents.
| Parameter | Description |
|---|---|
| UPDATE_PCT | The UPDATE_PCT parameter controls what percentage of SLOB operations that will modify blocks of data (modify DML.) Setting UPDATE_PCT to zero results in a 100% SQL SELECT workload. |
| RUN_TIME | The RUN_TIME parameter controls the wall-clock duration of a SLOB test in seconds. |
| SCALE | The SCALE parameter controls the size of data to be loaded into each SLOB schema. |
| LOAD_PARALLEL_DEGREE | parameter controls the number of Oracle Database sessions concurrently inserting data into the “base schema.” |
| THREADS_PER_SCHEMA | The THREADS_PER_SCHEMA parameter controls how many SLOB threads (Oracle Database sessions) will be performing SLOB operations against each schema during a performance test. |
| DATABASE_STATISTICS_TYPE | The default value is statspack. To generate Automatic Workload Repository (AWR) reports, set this parameter to “awr”. |
Platform and VM Instance
The platforms and VM instances hosting the Oracle database to be tested are configured as shown in the following table.
| Platform | Hardware Type | Instance Storage | Number of Cores per Instance |
|---|---|---|---|
| AWS | R5 | EBS General Purpose SSD (gp2) - up to 3000 IOPS | up to 96 |
| AWS | R5 | EBS Provisioned IOPS SSD (io1) - up to 80000 IOPS | up to 96 |
| VMware on AWS | i3.metal | vSAN with NVMe SSD from i3.metal | up to 36 |
| Sunlight on AWS | i3.metal | SDS with NVMe SSD from i3.metal | up to 70 |
| Sunlight on premise | Intel HNS2600BPB24 | SDS with Intel P4610 NVMe drive | up to 38 |
| Sunlight on premise | Intel HNS2600BPB24 | SDS with Intel Optane NVMe drive | up to 38 |
For the tests running across the different platform and instance setup listed above, the operating system of the instance hosting the Oracle database is always configured with the same approach. The Oracle database has been tested with the following host configuration.
| Resource | Value |
|---|---|
| Host OS | CentOS Linux release 7.5.1804 (Core) |
| Kernel Version | 5.2.14-1.el7.elrepo.x86_64 |
| Package manager | Yum |
| Application version | Oracle Database 12c Enterprise Edition Release 12.2.0.1.0 - 64bit Production |
Oracle Database Instance Setup
The instance hosting the Oracle database is configured as the steps listed below.
Host Environment Configuration
Replace the kernel as stock kernel does not have multiqueue blkfront.
sudo rpm --import https://www.elrepo.org/RPM-GPG-KEY-elrepo.org
sudo yum -y install https://www.elrepo.org/elrepo-release-7.0-3.el7.elrepo.noarch.rpm
sudo yum --enablerepo=elrepo-kernel install kernel-ml
sudo grub2-set-default 0
sudo reboot
The host operating system has been configured in the /etc/sysctl.conf file as the following setups.
fs.aio-max-nr = 1048576
fs.file-max = 6815744
kernel.shmall = 6180853
kernel.shmmax = 31645970432
kernel.shmmni = 4096
kernel.sem = 250 32000 100 128
net.ipv4.ip_local_port_range = 9000 65500
net.core.rmem_default = 262144
net.core.rmem_max = 4194304
net.core.wmem_default = 262144
net.core.wmem_max = 1048586
net.ipv6.conf.all.disable_ipv6 = 1
net.ipv6.conf.default.disable_ipv6 = 1
net.ipv6.conf.lo.disable_ipv6 = 1
vm.overcommit_ratio = 100
Oracle Database Installation
Install the prerequisite packages
sudo yum install -y binutils.x86_64 compat-libcap1.x86_64 gcc.x86_64 gcc-c++.x86_64 glibc.i686 glibc.x86_64 glibc-devel.i686 glibc-devel.x86_64 ksh compat-libstdc-33 libaio.i686 libaio.x86_64 libaio-devel.i686 libaio-devel.x86_64 libgcc.i686 libgcc.x86_64 libstdc.i686 libstdc.x86_64 libstdc-devel.i686 libstdc+-devel.x86_64 libXi.i686 libXi.x86_64 libXtst.i686 libXtst.x86_64 make.x86_64 sysstat.x86_64 zip unzip smartmontools bzip2 java-1.8.0
sudo yum groupinstall -y "X Window System"
Install the Oracle Database
Download the Oracle database package and install it using the installer wizard. More information about Oracle Database installation is available at Installation Guide provided by Oracle.
Tests Description
There are a set of variables involved in the tests to be adjusted for illustrating the performance metrics we are interested in. These variables are oriented from the resources required by the Oracle database and they are independent to any platform or hardware.
| Variable | Where to adjust | Influence |
|---|---|---|
| Number of cores | Specifying the number of cores when the instance is created. | Deciding the CPU resources available for the Oracle database to process both queries (SQL) and I/O. |
| Number of schemas | Specifying the number of schemas when running the setup script of SLOB and starting the SLOB workload. | Deciding the number of schemas loaded to the database during setup, and controlling the number of users to stress load the database when running the SLOB workload, since each schema belongs to a user. |
| Schema size | The SCALE parameter in the slob.conf file. | Deciding the size of the schema in the database. |
| Buffer cache size | The sga_target parameter of Oracle database defined in the create.ora file. | Deciding the amount of data to be cached in the memory, resulting in the cached data could be read from memory instead of physical disk. |
| Read/Write ratio | The UPDATE_PCT parameter in the slob.conf file. | Allow to test read/write performance only or a combination of read and write with certain ratio. The UPDATE_PCT parameter controls what percentage of SLOB operations that will modify blocks of data. Note: Oracle database will first read a block of data before modifying it. |
There are also a set of metrics which are indicators of the performance or resource on certain aspects in Oracle database. The value of these metrics are available in the awr report when the SLOB workload is completed. These metrics are analysed coherently to understand the specific performance metric when the resource metric(s) is within certain range.
| Metric | Indication |
|---|---|
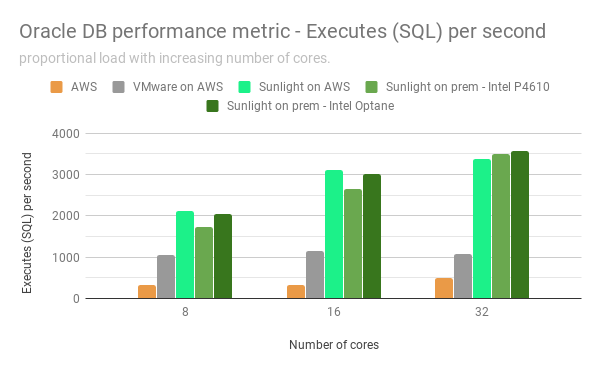
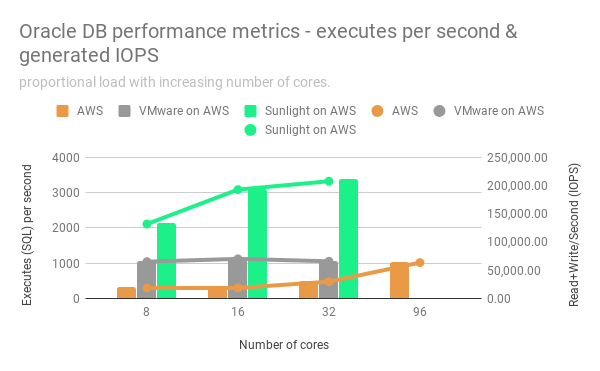
| Executes (SQL) per second | This metric represents the rate of SQL command executions over one second. |
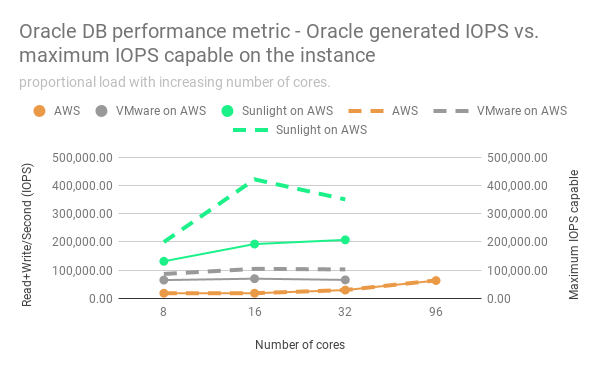
| Read+Write/Second | This metric represents the number of data blocks read from disk and written to disk per second during one second. |
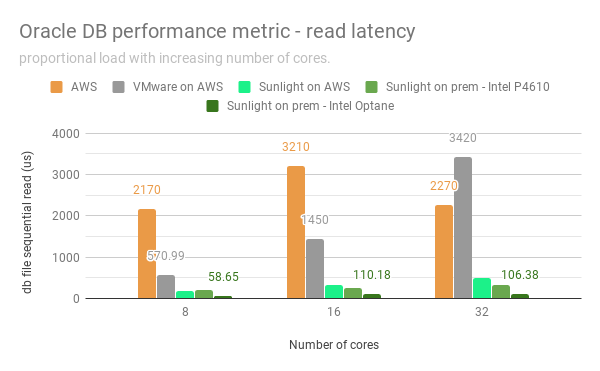
| db file sequential read | This metric represents a wait event initiated by SQL statements that perform single-block read operations, i.e. waiting for a physical I/O call to return. |
| Buffer hit ratio | This metric is a measure of the effectiveness of the Oracle data block buffer. The higher the buffer hit ratio, the more frequently Oracle found a data block in memory and avoid a disk I/O. |
| Idle CPU percentage | This metric represents the percentage of CPU cycles which are idle. |
Performance with increased number of cores
Test Setup
In order to test the performance of Oracle database when different number of cores are used by the instance, the other variables are selected accordingly to reflect the real-world setup as much as possible. With the increased number of cores, the number of schemas in the Oracle database are also increased to increase the load proportionally. The memory allocated to the instance and the buffer cache size of Oracle database are also increased. However, since the focus of this test is physical I/O performance, the instance memory and in particular the buffer cache size are configured in relatively small values. These variables are summarised in the table below.
| Number of cores | Memory size | Disk size | Oracle sga_target parameter | SLOB number of schemas | SLOB number of threads | Read/Write ratio |
|---|---|---|---|---|---|---|
| 8 | 16 | 500GB | 1500M | 4 | 1 | 1 |
| 16 | 32 | 500GB | 2000M | 8 | 1 | 1 |
| 32 | 64 | 500GB | 3000M | 16 | 1 | 1 |
The AWS R5 instance type has fixed configuration on number of cores and memory size, so the memory size on the AWS R5 instance is larger than other platforms, which however shouldn't cause difference as the memory usage by Oracel has been limited by the sga_target parameter. For the provisioned IOPS SSD attached to the AWS R5 instance, it is designed to deliver a consistent baseline performance of up to 50 IOPS/GB to a maximum of 64,000 IOPS. Thus, the disk size for the instance on AWS R5 configured to be large enough to achieve the maximum IOPS of each instance type.
Results
The following results are the average performance and resource metrics captured during the SLOB generates workloads for 5 minutes.
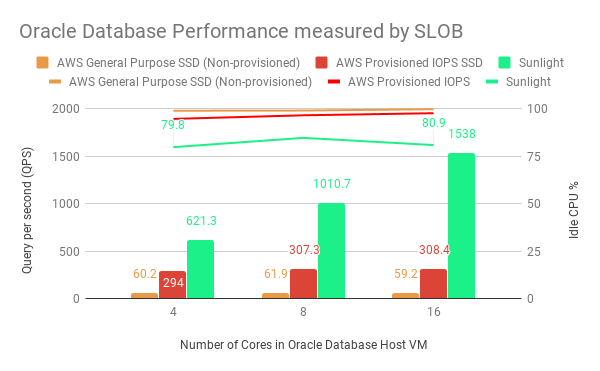
AWS R5
| Number of cores | Executes (SQL) per second | Read+Write/Second | db file sequential read | Idle CPU % | Buffer Hit % |
|---|---|---|---|---|---|
| 8 | 314.9 | 18724.4 | 2170 | 97.1 | 6.13 |
| 16 | 321.7 | 18709.9 | 3210 | 98.5 | 7.48 |
| 32 | 497.4 | 29800.4 | 2270 | 98.8 | 5.83 |
| 96 | 1040.6 | 63577 | 2300 | 98.1 | 4.85 |
VMware on AWS
| Number of cores | Executes (SQL) per second | Read+Write/Second | db file sequential read | Idle CPU % | Buffer Hit % |
|---|---|---|---|---|---|
| 8 | 1063.6 | 65282.1 | 570.99 | 89.8 | 5 |
| 16 | 1150.6 | 70192.6 | 1450 | 93.7 | 5.88 |
| 32 | 1075.3 | 65908.1 | 3420 | 96 | 5.37 |
Sunlight on AWS
| Number of cores | Executes (SQL) per second | Read+Write/Second | db file sequential read | Idle CPU % | Buffer Hit % |
|---|---|---|---|---|---|
| 8 | 2127.9 | 131870.3 | 178.41 | 68.5 | 4.73 |
| 16 | 3099.4 | 192851 | 334.97 | 70.9 | 4.32 |
| 32 | 3375.3 | 207703.3 | 501.69 | 69.9 | 5.31 |
Sunlight on prem - Intel P4610
| Number of cores | Executes (SQL) per second | Read+Write/Second | db file sequential read | Idle CPU % | Buffer Hit % |
|---|---|---|---|---|---|
| 8 | 1739.6 | 106221.8 | 206.31 | 64.1 | 5.89 |
| 16 | 2649.2 | 161918.7 | 248.62 | 63.2 | 5.86 |
| 32 | 3492.6 | 212258.5 | 315.99 | 61 | 5.94 |
Sunlight on prem - Intel Optane
| Number of cores | Executes (SQL) per second | Read+Write/Second | db file sequential read | Idle CPU % | Buffer Hit % |
|---|---|---|---|---|---|
| 8 | 2041.4 | 126299.5 | 58.65 | 52.4 | 4.68 |
| 16 | 3010.1 | 185156.2 | 110.18 | 56.4 | 5.52 |
| 32 | 3570.5 | 218713.2 | 106.38 | 53.3 | 5.5 |
Maximum random read IOPS of the instances on each platforms (measured by Fio)
| Number of cores | AWS R5 | VMware on AWS | Sunlight on AWS |
|---|---|---|---|
| 8 | 18800 | 87000 | 200000 |
| 16 | 18800 | 105000 | 422000 |
| 32 | 30000 | 103000 | 351000 |
| 96 | 64000 | n/a | n/a |
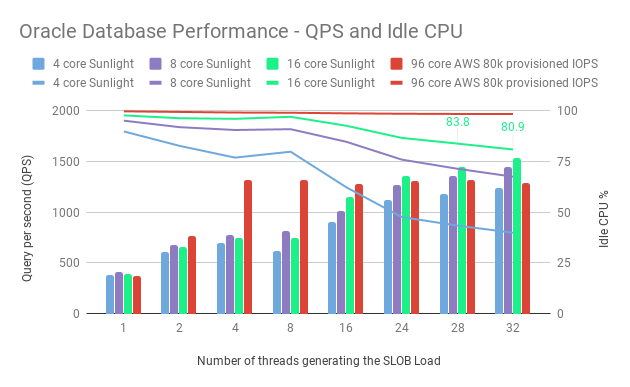
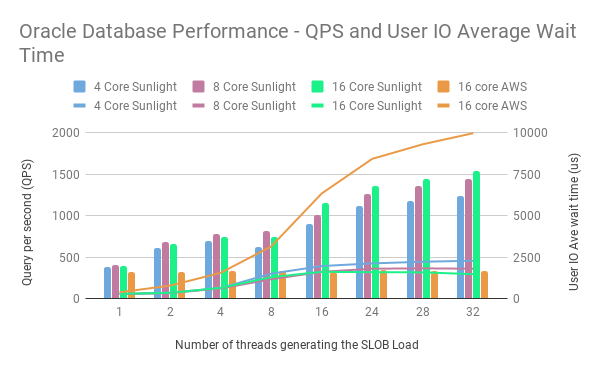
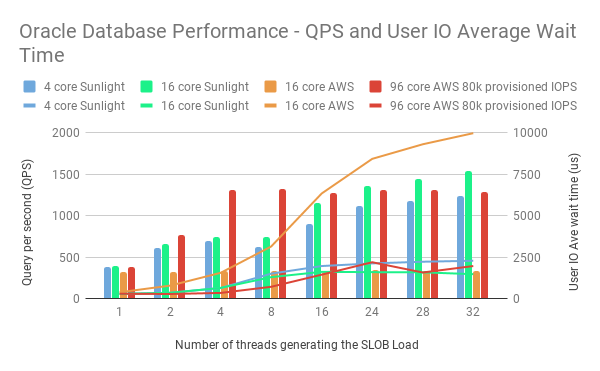
Performance with increased load